DJDBOX
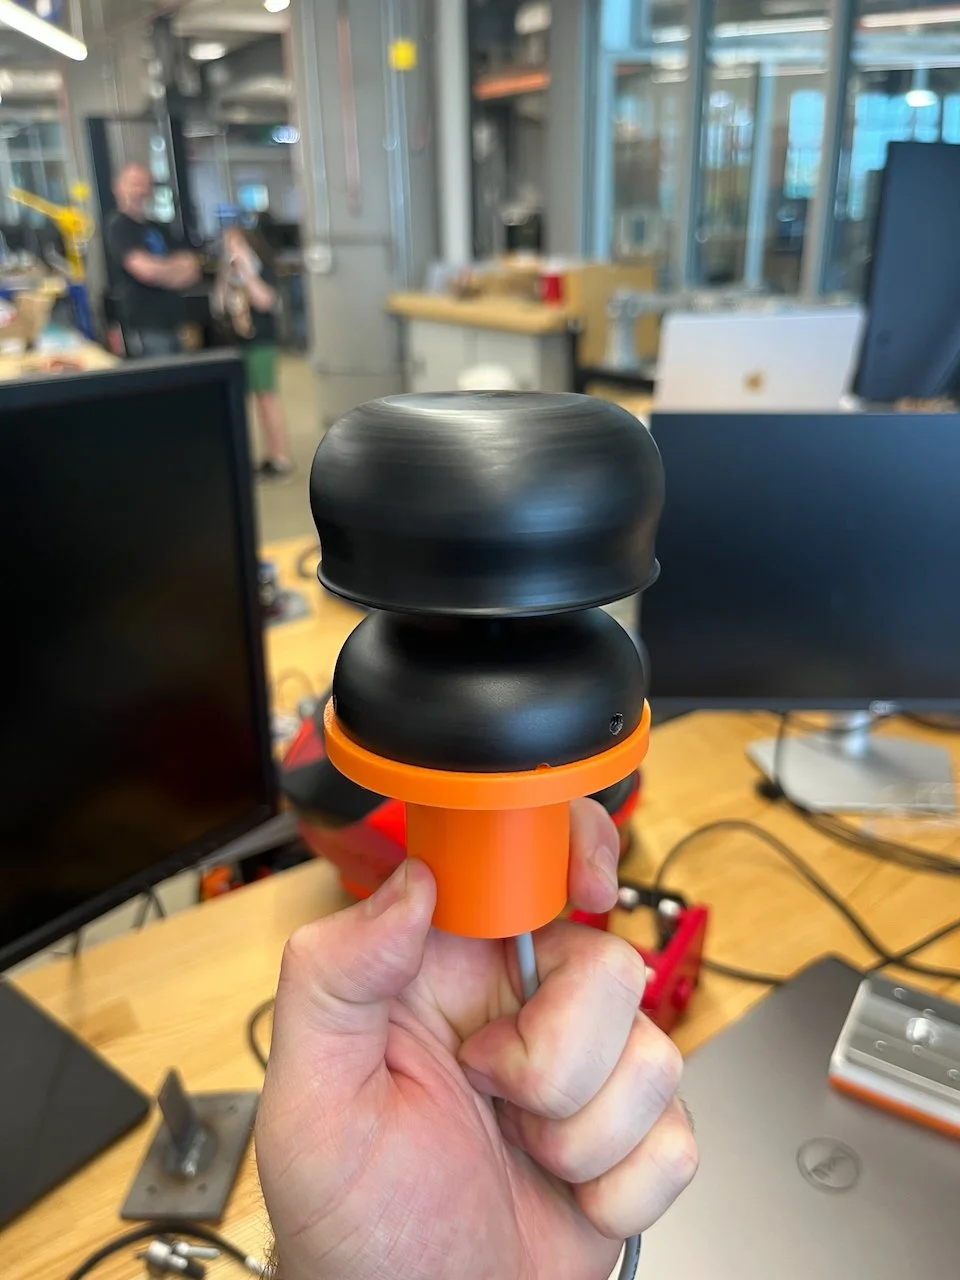
DJDBOX is a data collection box I designed, built and deployed as part of my work with Aloft Systems. It collects and transmits weather and vessel data.
DJDBOX is a data collection box I designed, built and deployed as part of my work with Aloft Systems.
Aloft primarily builds modular sails that can be retrofit onto cargo vessels to improve performance, reduce fuel consumption and minimize emissions.
In order to both design the sail, and evaluate whether a particular vessel is appropriate for a wind-assist retrofit, we need a bunch of data.
Data
In order to effectively design the sail, and to evaluate fit on a ship, we need a wide variety of data from wind and weather conditions, to voyage data like where the ship typically travels, and how fast.
Ships’ crews do typically take a log of weather and sea state, but it’s typically done once per watch (every handful of hours), and it isn’t particularly precise or accurate. Additionally, because of regulatory requirements and cybersecurity concerns, it is very difficult to tap into any data sources the ship itself logs.
I designed DJDBOX to be a completely self-sufficient device that takes all the measurements we needed (and more), at a much faster sample rate, in order to feed high fidelity aerodynamics simulations and fuel consumption models.
Sensors
Anemometer
Apparent Wind Speed
Apparent Wind Direction
GPS
Position lat/lon
Vessel Speed Over Ground
Vessel Course Over Ground
Altitude
9-Axis IMU
Accelerometer
Gyroscope
Magnetometer
Software Defined Radio Receiver
Listens for all AIS messages from our ship and nearby ships. Data includes origin, destination, heading, and a variety of voyage information.
DESIGN and Build
The ship Aloft was partnered with typically travels to uniquely difficult places to travel to. When we found out the ship would be in France, we jumped at the opportunity. We had just under 2 weeks to design, build and deploy it before it departed again for Africa.
REUSE
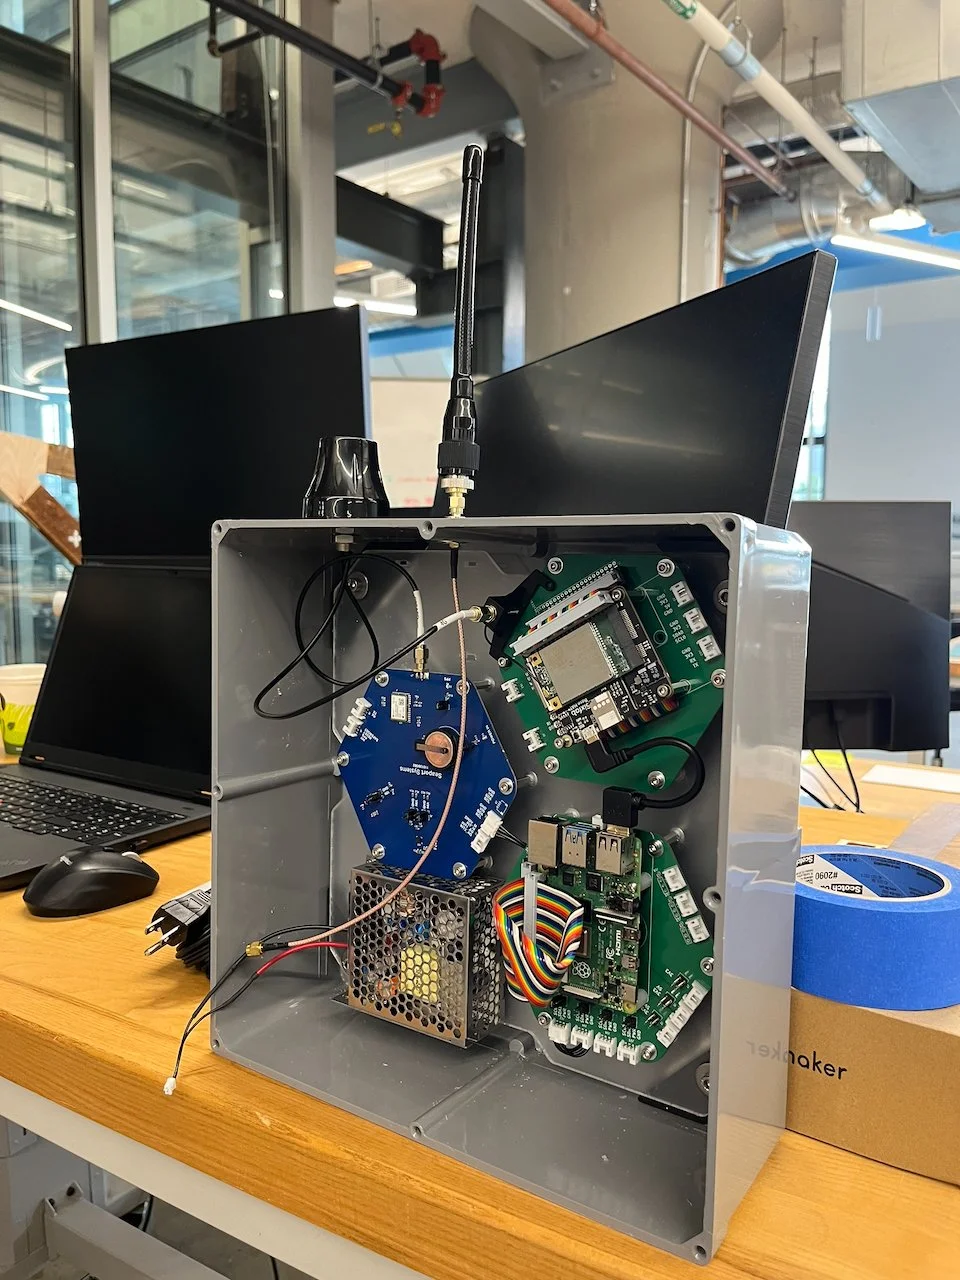
Thankfully, I had actually done most of the heavy lifting already. For a little over a year, I had been developing a set of compute and sensor modules for a buoy I was designing for Seaport Systems (this system of modules would be the precursor to the Modular Monitoring System I’m developing today).
I had already built out a compute, cellular telemetry, attitude, and temperature/pressure module. All I needed to add was an anemometer and software defined radio. Additionally, the original modules were designed to be powered by a solar panel and battery, but because the ship could provide us with 220V power, I had to add a power supply, and regulate the voltage down to the levels the modules accepted.
I was able to spin up a new power management board in KiCAD in a couple of days, have it ordered.
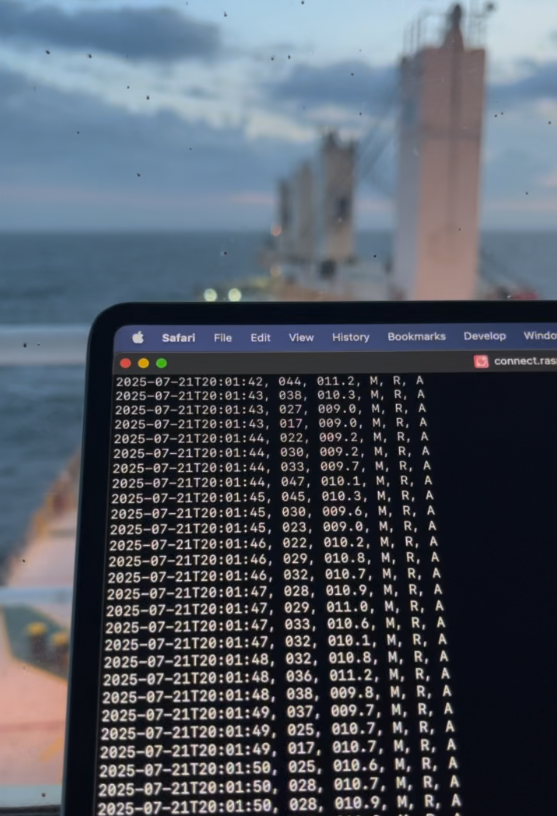
I bought an I2C/UART solid-state anemometer, which was incredibly easy interface with. The documentation wasn’t the best, but it didn’t take long to put together a basic driver in Python to access it over the UART interface.
The SDR simply plugged into the compute module using USB, and had its own software suite to decode and log AIS data, no heavy lifting at all.
Telemetry
Telemetry, data handling and storage proved to be the most interesting part of this whole endeavor.
Because we weren’t using the data in real-time, we didn’t need to transmit it over satellite. I opted to use a 4G cellular modem that would connect and dump data anytime the ship was near shore or in port.
Because internet isn’t always available, I opted not to use MQTT to broker data like I have in the past. Instead, I had the device save all of its data and logs to CSV files, and batched those by day. Even though we aren’t as limited for bandwidth with cellular as we might be with satellite, data still wasn’t cheap, so zipped every day’s data into .tar.gz archives, and queued them for upload.
I setup a data ingestion pipeline on AWS to handle all of this. When DJDBOX was in range of cellular signal, it would upload any queued archives to AWS S3. From there, a Lambda function would unzip the archives.
I built a unique Lambda function for every type of data file we were transmitting, with an event listening for new S3 files of a specific prefix and suffix. They would ingest the raw .csv file, do some basic data sanitation and validation, then dump that into a DynamoDB table I could access later for analysis.
Data Visualization
Now the fun of actually taking all the collected data and turning it into something useful. A lot of this work is still ongoing, and I’m not going to spill the beans on anything particularly sensitive, but it’s worth noting regardless.
Streamlit
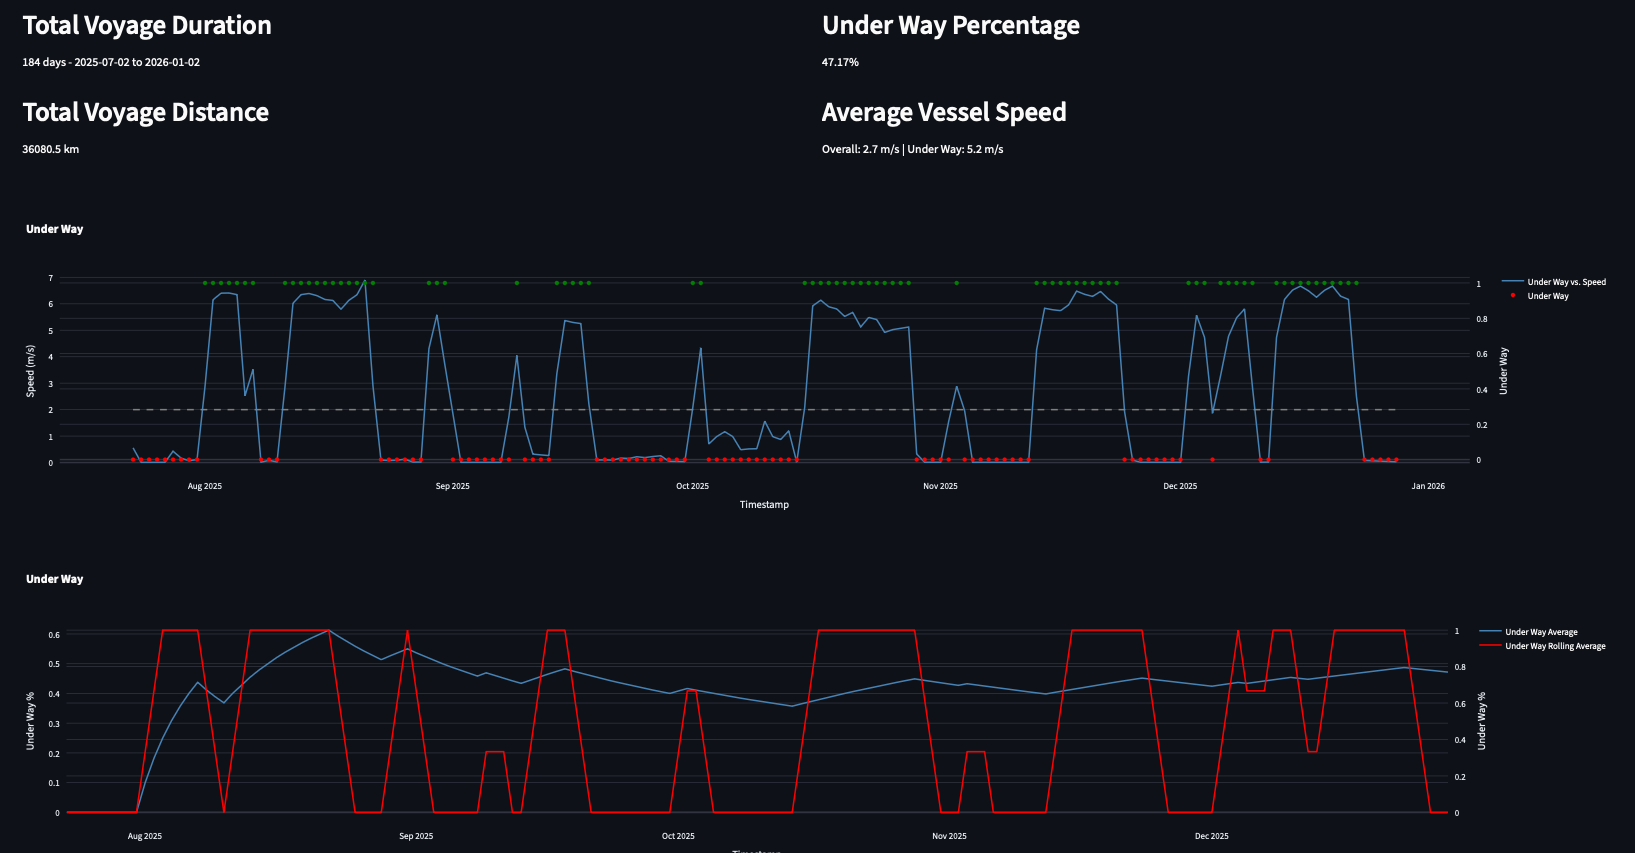
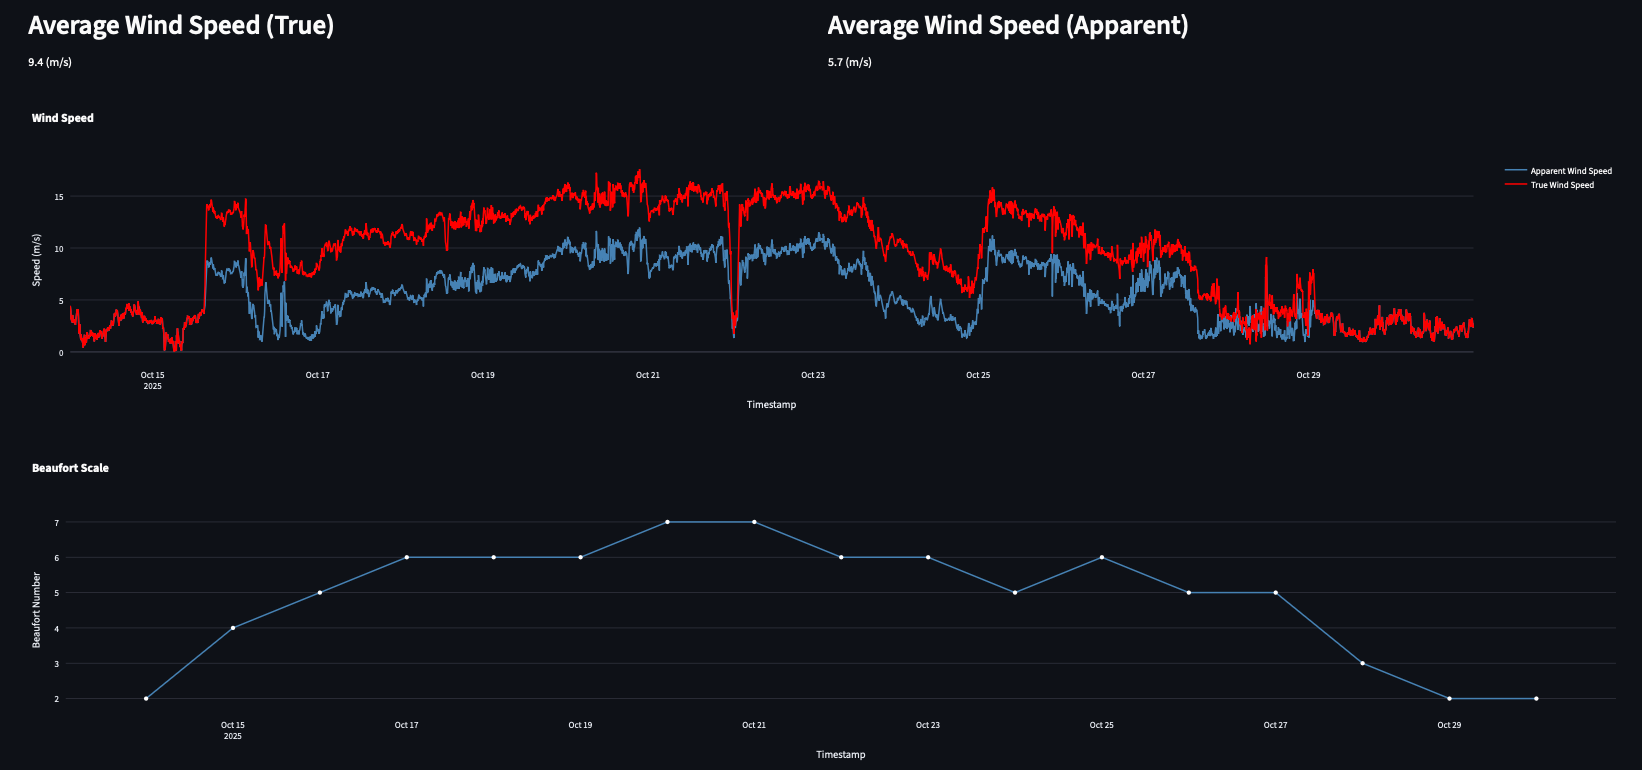
The goal of DJDBOX was to generate a bunch of data both for internal engineering and generate value to vessel operators by allowing them to more accurately visualize their voyages, performance and operations.
I’ve used Streamlit, a really great Python framework to do this. It runs as a web server, and lets you write Python code to quickly and easily generate beautiful dashboards, graphs and tools.
I use the Boto3 Python module to connect back to our AWS infrastructure to query data out of our DynamoDB tables and S3 buckets, and bring that into Pandas Dataframes for manipulation and analysis.
Streamlit is really great because it has its own graphing framework, but seamlessly integrates with other more familiar and powerful tools like Plotly, Matplotlib, and Mapbox. This has made it incredibly easy to build data rich, interactive tools to analyze vessel and contract performance.
I’ve been using these tools internally for a number of things, but Aloft also hosts a set of customer facing dashboards I deployed on an AWS EC2 instance. Deployment incredibly straightforward thanks to the built in web server - I can just deploy changes to git and roll them out to production with a couple of commands.
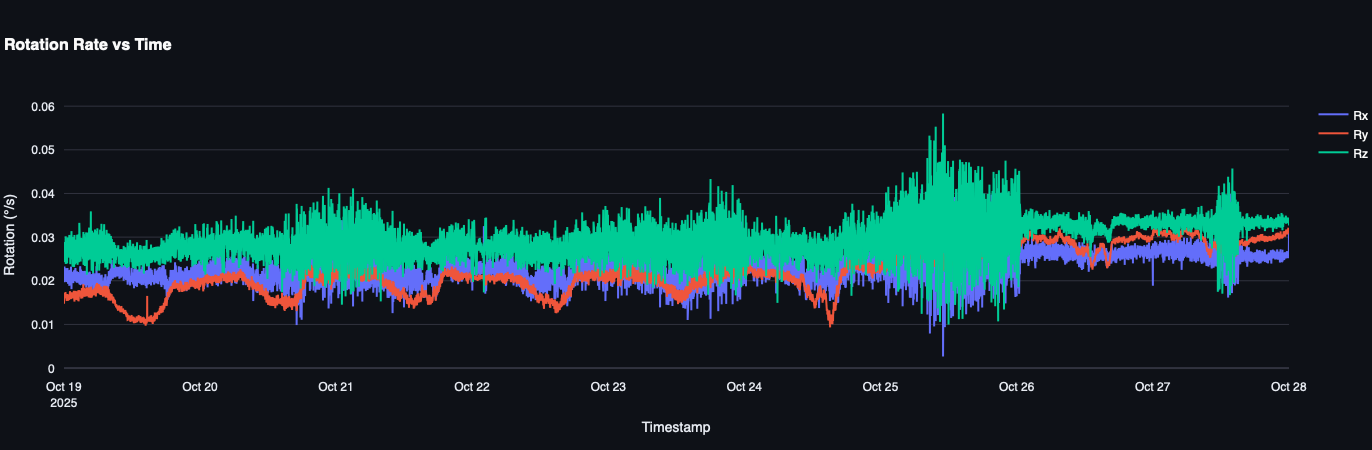
IMU Data
I haven’t sunk my teeth into this too much, but I have been on a fascinating cursory review of the IMU data generated at sea. The IMU data is helpful for a couple of things: first, I run a sensor fusion algorithm on it to determine the ship’s pitch and roll, which is great for estimating sea state and conditions its experiencing; second, there’s all sorts of vibrations aboard ships, everything from main engines, to hotel generators, cranes and all sorts of stuff.
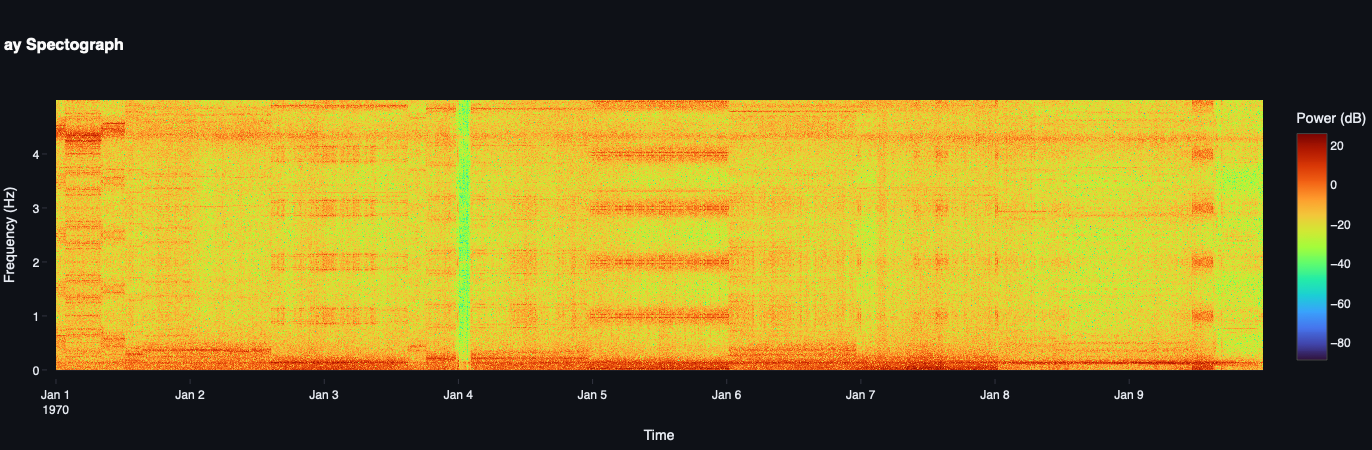
I used NumPy to take Fast Fourier Transforms and generate Spectographs on both the raw IMU data, as well as the pitch and roll data to try and better visualize sea state, and other ship behavior.
I haven’t looked at it much since generating the plots, but it is really clear when the ship is steaming, when it’s idling at anchorage, and when it’s being shunted around port by tugs.
The data is a little too noisy, and this isn’t by any stretch a novel concept, but it would be neat to be able to determine main engine RPM from a cheap IMU.